Bull Market In Stocks
People often talk about a bull market and in general this means that the stock market is going up. The reason Wall Street uses the Bull and Bear to describe the trend of the market is because when a bull attacks it goes up with it’s horns. When a Bear attacks it goes down with it’s claws. So that is where the analogies for an up or down market originate.
How do you know if stocks are in a Bull Market?
This is probably the most important piece of information that any investor can possess and yet very few people talk about it. We sit and listen to all the economists on CNBC blabbing about the economic data but that has little to do with whether the market goes up or down. Fundamentally, stock prices are dependent upon the level of future corporate earnings. When you look back over time you can see a very high correlation between the combined earnings of the S&P 500 companies and the level of the S&P 500. The market tends to lead the earnings growth by about 6 months, so the market usually turns up or down ahead of actual earnings changes.
Best Bull Market Technical Indicator
Over the years I’ve read many different philosophies such as using sentiment indicators, RSI Divergence, Moving Average Convergence/Divergence (MACD) but nothing even comes close to the power of the 20 Month Simple Moving Average. In fact, if I could only use 1 single data point for investing… this would be the one.
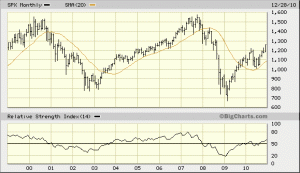
Take a look at this chart and you will see why:
By looking at this chart you can see that by simply being in the market during the bull market phase when the price is above the line and out when the price is below the line you would’ve done quite well. In fact, you would’ve captured the majority of both runs in stocks and missed out on two devastating declines in the past decade. You can see that in 2009 we got back above it and then had a retest of it in August 2010. That successful retest lead to the incredible rally we had this fall. In early to mid-2011 there will most likely be another retest which would be similar to what happened in 2005. When you see the market go down and hold support at that average, that is usually a low risk time to add to your stock holdings. When the market gets too far ahead of itself (like right now), then it’s a good time to cut back on your holdings. It’s a very simple system.
If the market closes out a month below the line and doesn’t immediately recover then you should seek protection by moving to cash, buying put options or even use a Short ETF. Many people try to speculate on a stock market crash, but I have found that to be a very difficult thing to do. If you are going to try, only do it when the market is trading below the 20 Month Moving Average. That will tend to keep you from fighting the tape.
I find it easier to follow a technical indicator than to monitor the earnings of the S&P 500 companies, so that’s why I use the 20 Month SMA as my primary indicator of whether we are in a bull or bear market in stocks.

