CTMPR

Concise Training For A More Profitable Retirement!

S&P 500 Held Support – Then Failed

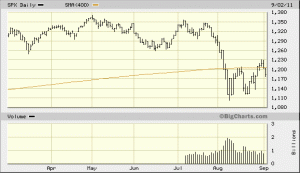
The good news is that the S&P 500 managed to close out the month of August above support at 1202 ($119.62 for the SPY S&P 500 ETF). The bad news is that the first two days of September have seen the market slice back through that support level. The charts at this point look bad and the daily chart looks like the market will at least go back and test the August lows.

At this point I’m keeping lots of cash on hand until we see how this plays out. Looking at the German DAX it’s very possible that Europe is going to continue to drag us lower. Our financials are once again taking a beating and it seems there is no catalyst in sight that could turn them around.

When everyone comes back after Labor Day it’s going to be interesting to see if they are ready to buy or if they will continue to take off risk. If they take a look at the charts on Tuesday morning, they won’t like what they see.

For now it’s just to wait for more market direction. Many people are talking about a retest of the August lows as being the ultimate downside risk but unless we can stop penetrating the 1200 level on the downside, this market is on life support.

S&P 500 Testing Critical Support

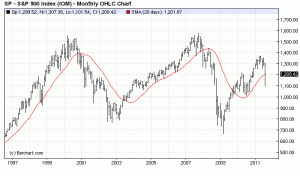
Most stock market participants may be thinking the worst is over for stocks, others think we are on the verge of another 2008 collapse. This is one of those times when there is a tremendous amount of uncertainty. In fact, other than 2008 and 1987 uncertainty is as high as it’s ever been. A few weeks ago I told you about the only stock market indicator that matters which is the 20 month simple moving average. This is a very simple indicator, if the S&P 500 index closes the month above the line we remain in a bull market. However, if the average closes below the line we are almost certainly entering another bear market similar to 2008-2009.
S&P 500 Bull And Bear Market Indicator

In order to avoid that, we will want to see the S&P 500 ETF close above $119.62 and the S&P 500 cash index above 1202. As I write this the S&P 500 cash index is trading at 1208 after climbing back above the moving average during yesterday’s huge rally. It is possible for this indicator to give a false signal but that doesn’t happen very often. As you can see in the chart above the severe Asian crisis related sell off in October 1998 closed right on the average and it continued to jab it in the weeks ahead before going back to new highs. This is what I’m hoping will happen in this case. You can see that last year the market was testing the 20 month average at the time Bernanke announced QE2. The successful test was the best buying opportunity of the year.

However when you look back at 2000 you can see that after breaking below the line in October 2000 it managed to close well above it. Then in November it took out the October lows before rallying back up to the line and failing. Again in January the highs were just below the line and that was the final tipping point.

If we close out the month of August above the line, I would like to see a retest of the line in September and have it hold. If it drops back below it next month that would be a sign of ongoing weakness. The market got fairly washed out in the first half of August so there really shouldn’t need to be more weakness unless there really is an underlying problem such as a double dip recession. That is what is ultimately going to play out if we do go into a second bear market move. The market normally leads the economy by 6 months, so if the market breaks down from here so will the economy.

I am currently long stocks and especially bullish on the Nadaq and the oil etf (XLE) as the energy stocks were literally pounded during this market decline. However, if we go back below 1200 I will be out of stocks. I would rather miss out on a rally than sit through a beating like the one we saw in 2008-2009. In fact, I’ll probably check out the short etf list and see if there are a few candidates to catch the downside.

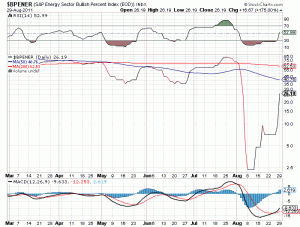
However until the market fails you can see by the chart below that the Bullish Percentage for oil stocks recently reached 2 and is just coming off the bottom. This is why I’m bullish on energy stocks unless the bottom falls out of the S&P 500.
Value Investing For Beginners

There are many philosophies when it comes to investing and one of them is known as Value Investing. Benjamin Graham is credited with being the father of modern day value investing. He wrote two influential books called “Security Analysis” and “The Intelligent Investor” which laid out much of his methodology. The basic premise is to buy a stock or security at less than it’s intrinsic value. By buying at a discount the investor will theoretically have less risk than if he were paying full or an overly inflated price.

Warren Buffet is the most well known value investor of our time. His philosophy is to buy great companies when they are out of favor and hold them for very long periods of time. Buying companies like Coca Cola and Wells Fargo at times of uncertainty has proven to be a very good strategy for Warren and his company Berkshire Hathaway. This type of investing takes lots of patience which very few investors have. It also requires quite a bit of research that most casual investors aren’t willing to do. That’s why there are advisory services that focus on value investing as well as stock screeners.

One free service that I’ve used over the years to look for ideas is the Magic Formula approach by Joel Greenblat @ magicformulainvesting.com. This service tends to find out of favor companies that are trading cheap relative to cash flow. Right now it’s showing a combination of Large Cap Tech like Microsoft, Dell, HP, Applied Materials, KLA Tencor, Cisco and Analog Devices to name a few. Many of these large tech stocks are trading well below their highs over a decade ago despite growing their earnings over the years. Other candidates are companies who have erosion taking place in their markets like Unisys and Deluxe. There are also several Online Colleges in the bunch as they are extremely out of favor right now. One that I find interesting is Dolby another is Forrest Labs as Carl Ihcan has been rattling the cages at this company for awhile now. Gamestop also makes the list as well as defense contractors Northrup Grumman and Raytheon which are out of favor due to pressure on government spending. There are also some chronic entries on the list such as ViroPharma which has been on this list for years!

There are ways to play value using ETFs as well, if you look at the Technology ETF space you will see that all of the large cap oriented funds contain several of these undervalued companies. Large cap tech as a whole is probably the most undervalued sector of the market.

In 2000, it was small cap value that was severely undervalued as all the focus was on Large Cap Tech and the Nasdaq 100 so its funny how times change. The Small Cap ETF – IWN focuses on value stocks and has been a superior performer the past decade as you can see by the chart below comparing it to the S&P 500 ETF.

The hard part about value investing is that you have to learn to be a contrarian and buy when others are throwing away the stock. It takes lots of discipline but can be extremely rewarding.